|
At long last we have been able to enjoy some clear skies and the Moon was prominent high in the sky last month with a close approach to Mars in the middle of April and a super moon on the 27th April. Observing The following charts represent the night sky at 10.00pm BST on the 8th of May and at 9.00pm BST on the 23rd May. To use the chart, face south at the appropriate time with the bottom of the chart towards the southern horizon and you will see the stars in the chart. 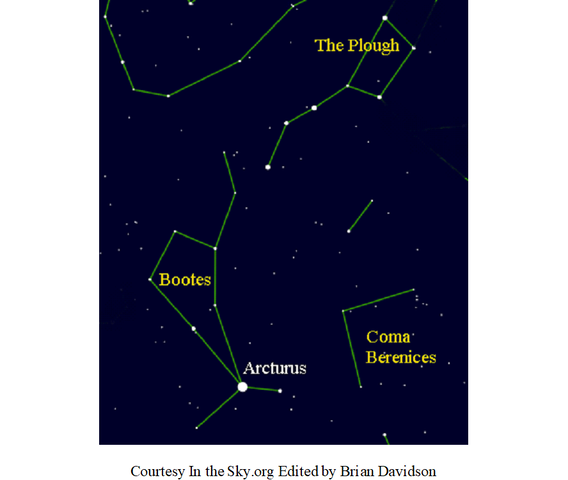 We’ll start from The Plough which we discussed last month and you will notice that it has continued on its anti-clockwise journey round the pole star and is now slightly west of south with the middle of its handle at your zenith. Follow the arc of the handle of the Plough downwards round to the star, Arcturus, which has the distinction of being the second brightest star visible in the northern hemisphere at magnitude -0.05. Also known as alpha Boo (alpha meaning it is the brightest and Boo a short form of Bootes). It is an orange giant nearing the end of its life and relatively close at a distance of 36 light years. It is the brightest star in the constellation Bootes (The Herdsman) and again it is difficult to distinguish such a figure whereas the Kite asterism is easier to see and is what most people recognise as Bootes. In mythology the constellation Coma Berenices is supposed to represent the locks of Queen Berenice of Egypt but it contains no stars brighter than magnitude 4 so doesn’t present much to observation with the unaided eye. I recall that it was an answer to a quiz question so if it comes up again at least you will have heard of it. 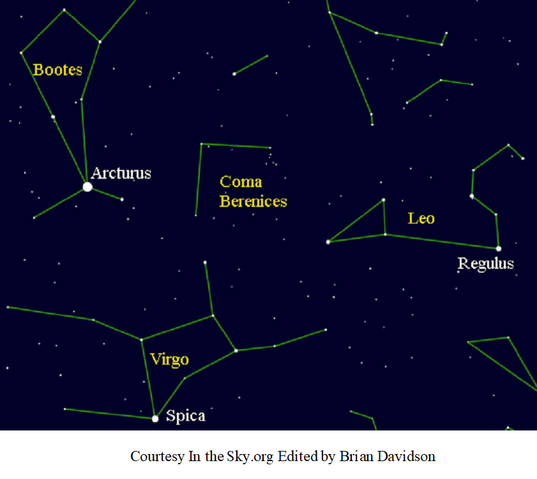 Carry on following the curve of the arc from Arcturus for about the same distance again until you see another bright star. This is Spica the brightest star in the constellation Virgo- The Maiden. Virgo is of course one of the zodiacal constellations as it lies on the ecliptic. Spica is a blue-white star with an average magnitude of about 1 and is 260 light years from Earth.
It may be easier to memorise these two star hops using the expression (Arc on to Arcturus and Speed on to Spica). Now look to your north west and from last month you should recognise Leo- The Lion with Regulus shining brightly. Turn to face Leo then look up and you are back at the Plough. Something to look out for The challenge this month is to spot the planet Mercury. This is always quite tricky because it is low in the sky and only visible for a short time after sunset in the North West sky. It will be at its brightest early in the month but close to the Sun and it will be at its highest altitude on the 16th May. You will need a clear view to your West/North West horizon and if you have the use of binoculars so much the better. On the 4th May it will be on its easterly journey just below the Pleiades and above and to the left of our old faithful Venus which is significantly brighter. A better opportunity to spot it arises on the 13th May when a crescent Moon, Mercury and Venus form an isosceles triangle about 40 minutes after sunset. I can’t finish without saying how good it is to have Venus back in the evening sky and it will be just above a crescent on the 12th May. Clear skies.
0 Comments
The earliest method of enabling astronomers to determine the distance to remote objects is the parallax method. As Earth orbits the Sun, we see an apparent shift in the positions of stars relative to much more distant stars, called parallax. For nearby stars, the parallax is larger and for more distant stars the parallax is smaller. The baseline used by the parallax method is fixed by the size of Earth's orbit around the Sun. Recall that like all orbits, that of the Earth is an ellipse rather than a circle. The mean Earth–Sun distance, or Astronomical Unit (AU), is approximately 1.5 * 10 to the power 9 metres. Earth's orbit is so nearly circular that using the mean distance is accurate enough for these purposes. As shown in Figure 1, if we observe a star's position with respect to the distant stellar background between two observations that are six months apart in time we will see the parallax shift in our data. The observation baseline is 2 AU. 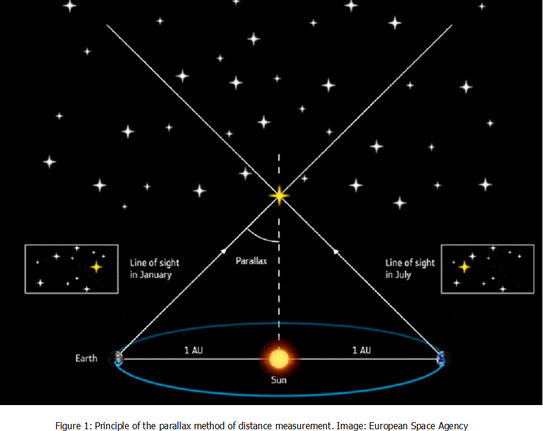 At this point, let us to define a unit of distance called the parsec. This unit of measure is defined as the distance at which 1AU subtends an angle of 1 arcsecond to the observer. 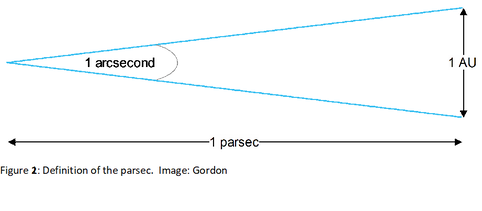 Hence referring to Figure 2, the distance to a remote object is given by: 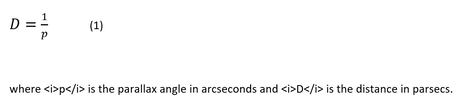 Some examples are shown in Table 1, where stellar distances are derived from parallax angle using equation (1). 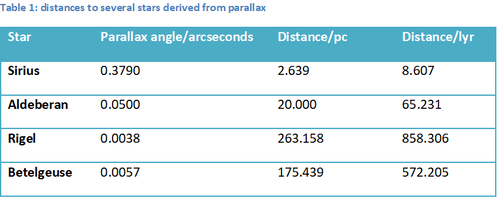 Limitations of the parallax method Looking at the results above, we can see that distance values for the first two stars agree quite closely with recognized values. However, the distances for Rigel and Betelgeuse do not agree very well with accepted values. These stars are both "nearby" in that they are both very much naked-eye objects. So where does the problem lie? Parallax angles of less than 10 milliarcseconds (mas) are very difficult to measure using Earth based telescopes due to atmospheric effects. Using equation (1) and considering a parallax angle of 10 milliarcseconds: 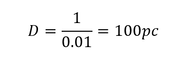 Hence, distances greater than 100pc pose increasing difficulty for ground based instrumentation. In 2008, researchers using the Very Large Array (VLA) produced a radio solution of 5.07±1.10 mas for the parallax angle of Betelgeuse, corresponding to a distance of 197±45 pc or 643±146 lyr (Harper et al, 2008). In this paper, Harper et al also point out that the angular size of Betelgeuse is greater than it's parallax angle, creating further problems when observing such large stellar objects at this distance range. The European Space Agency (ESA) Hipparcos satellite mission made it possible to measure the parallax displacements with an accuracy of up to 0.1 mas a big improvement allowing parallax measurements to be theoretically useful up to 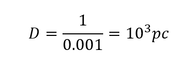 The follow-on ESA mission, Gaia can measure parallax angles to an accuracy of 0.01 mas giving useable distance measurements up to: 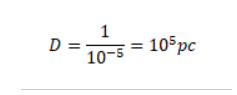 So we can see that the use of space-based telescopes has extended the range at which the parallax method is of practical use by about 1,000 times. What part does distance measurement play when observing stars? We'll consider three cases where knowing the distance to a remote object is key in undertanding that object's properties. In each case, the reason this is so important is because we can't measure a remote object's luminosity directly. The luminosity of a remote object is observationally determined by measuring its magnitude. Here we are essentially examining ratios of flux density. Whereas luminosity is independent of distance, flux scales inversely with distance according to Newton's inverse square law, so an accurate determination of luminosity requires an accurate knowledge of distance. 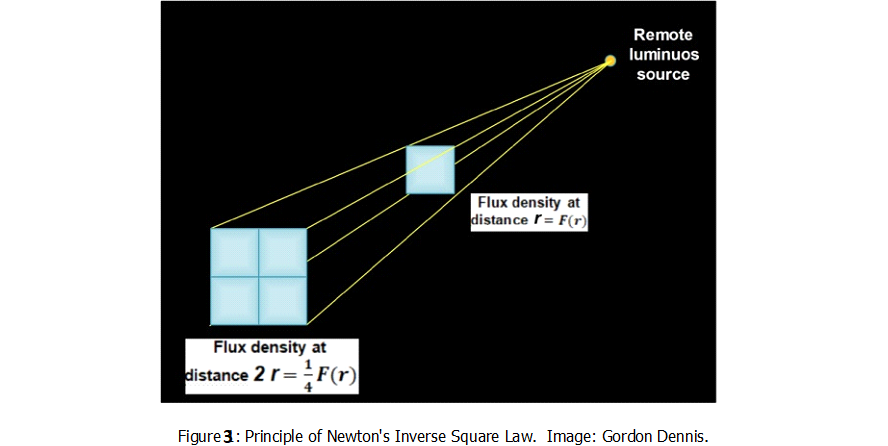 In practical terms, the inverse square law states that if we have two objects of the same luminosity, one twice as distant than the other, then the flux density of the more distant object will be one quarter of that of the nearer object. Case 1 - the size of a star We can estimate stellar radius by using the Stephan-Boltzmann Law: 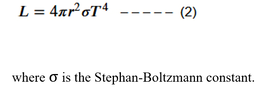 We can measure the luminosity of the star, L, by photometry. That is, provided we know the distance from us. We can measure and its photospheric temperature, T, by spectrometry. Some simple algebra allows us to determine the star’s radius in terms of the solar radius is: 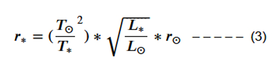 Those who saw my webinar on the Hertzsprung-Russel diagram last year may recall this equation. Measuring stellar parameters in terms of Solar units is commonplace in astrophysics as it simplifies calculations considerably. In this case, we don't even need to know the value of the Stephan-Boltzmann constant. But we do need to know the distance. Case 2 - the size of an exoplanet When an exoplanet (a planet orbiting a star other than the Sun) crosses the face of the star as seen by an Earthly observer, it causes a dip in the observed magnitude of the remote star. The characteristic light curve of the star will appear similar to Figure 4, in this case of the star WASP-2A being transited by its planet WASP-2A-b: 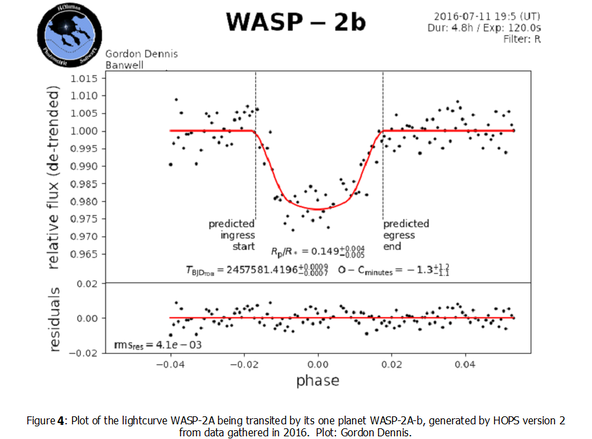 HOPS is made available as part of a pro-am collaboration project called Exoclock. The goal of the Exoclock project is to make as many observations of confirmed exoplanet transits as possible. Amateur participation is valued as there is simply not enough time available on professional telescopes. Because the cross sectional area of both the star and the planet scale by radius squared, the transit depth, is related to the squares of the ratio of stellar radius and planetary radius: 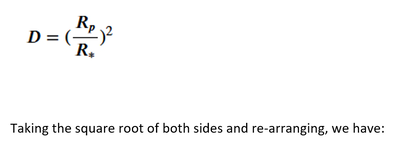 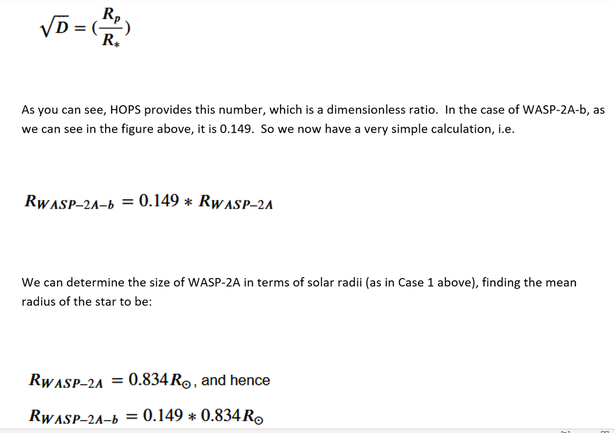 So, in this case also we can infer the size of the exoplanet in terms of the solar radius, but to know the value of this in metres, as in case 1, we must again know the distance. In the case of WASP2-A-b, it turns out that -according to this light curve- the planetary radius is 1.23*RJ where 1.23*RJ is equal to the radius of Jupiter. The published value in the exoplanet.eu/catalog is 1.079 ± 0.033 RJ, so we are reasonably close. Nevertheless we can classify WASP2-A-b as a Jupiter-size exoplanet. Case 3 - the mass of a star The mass-luminosity ratio is stated in relation to solar units as: 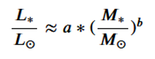 However, the relation is highly empirical in the sense that both the coefficient a and the exponent b depend on the mass of the star. Almost as if you have to guess the mass first! For a very small star (e.g. a red dwarf), a = 0.23 and b = 2.3. For a star comparable to a solar mass, a = 1 and b = 4. For a star with a mass comparable to Betelgeuse, a = 1 and b = 3.5. In this case also, to calculate the mass of another star in kilograms (or any other units of mass), we need to know the distance as accurately as possible so that we can calculate its luminosity. The mass of a star also determine its ultimate fate. There was great excitement in the popular press at the end of 2020 to the effect that "Betelgeuse was about to go supernova". This was prompted by the fact that Betelgeuse had dimmed considerably. In fact, this is now believed to be because Betelgeuse had expelled a great deal of its atmosphere as dust, causing the apparent dimming of magnitude (Kidger, 2020). Table 2 is based on much more detailed modeling published in 2015 (Woosley and Heger, 2015 - refer to Table 1, page 3) 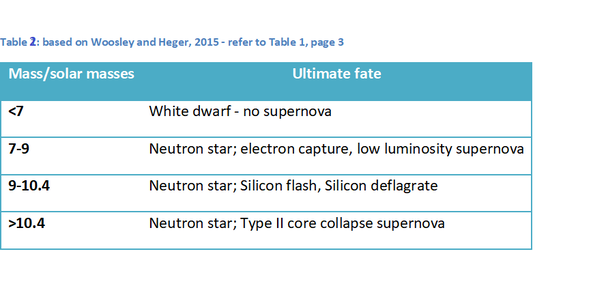 Conclusions
1. The parallax method is earliest method used todetermine the distance to remote objects. Space-based observatories such as Gaia have extended the effective usefulness of the method out to ~10 to the power 5 pc. 2. In order to calculate parameters such as size and mass, it is necessary to have an accurate value for distance. Note that we can calculate the mass of a star in abinary system, but we then need the mass of the other star. 3. Measuring stellar parameters in terms of Solar units is commonplace in astrophysics. For example we know that M⊙ = 1.99*10 to the power 30 kg. How we determine soar parameters will be covered in a future blog. 4. Betelgeuse is in many respects an enigmatic object. Because its distance is not known precisely, so neither is its luminosity. That also means its mass is not known precisely and hence the ultimate fate of Betelgeuse is uncertain. References Harper G et al. (2008). A new vla–hipparcos distance to Betelgeuse and its implications https://iopscience.iop.org/article/10.1088/0004-6256/135/4/1430/pdf, Accessed April 14, 2021. ApJ, 135:1430–1440, 2008 April. Woosley, S and Heger, A (2015). The remarkable deaths of 9–11 solar mass stars https://iopscience.iop.org/article/10.1088/0004-637X/810/1/34/pdf, Accessed April 14, 2021. ApJ,810:34(20pp), 2015 September 1 Kidger, M (2020) Supernova Betelgeuse https://britastro.org/jbaa/pdf_cut/jbaa_25295.pdf , Accessed April 14, 2021. Journal of the British Astronomical Society, 2020 December. I am quite surprised that this month’s blog will complete a year of them, meaning that we have been all the way round the night sky. By the nature of the subject there will be a bit of repetition from now on but there is always something new happening and who can ever tire of looking at a lovely starry sky even if you have seen it before. We passed the spring equinox on the 20th March so we are getting more daylight and the clocks went forward an hour on the 28th March so it will be later before the sky darkens. The good news is that we have had some clear nights and seeing Mars, Aldebaran, the Pleiades and a crescent Moon all together just after the middle of the month was particularly pleasing. Since we are making a fresh start I thought that it would be a good idea to repeat the bit about the celestial sphere and how the sky changes in appearance from night to night and month to month. I hope this will prove useful to any newcomers to the subject and any youngsters who are hopefully embarking on observing the skies as a lifetime’s hobby. The Celestial Sphere Before we venture outside let us recall some helpful facts. It is useful to think of the sky as a hollow sphere which has the Earth at its centre and to which all the heavenly objects are attached. This sphere is known as the celestial sphere. Just like when you visit a planetarium. The celestial sphere also has north and south poles directly above the corresponding poles on Earth and a celestial equator directly above the Earth’s equator. Far away objects such as stars and galaxies are in more or less ‘fixed positions’ on the celestial sphere whereas the Sun, Moon and planets continually shift their positions but stay close to a circular path on the sphere’s surface called the ‘ecliptic’ which is tilted to the celestial equator because the Earth’s axis is tilted by 23.5 degrees to the plane of its orbit. In reality of course the Earth revolves round the Sun and the ecliptic is where the plane of the Earth’s orbit cuts the celestial sphere. This makes sense because when we observe the Sun we are looking along the radius of the Earth’s orbit and hence in the plane of its orbit. 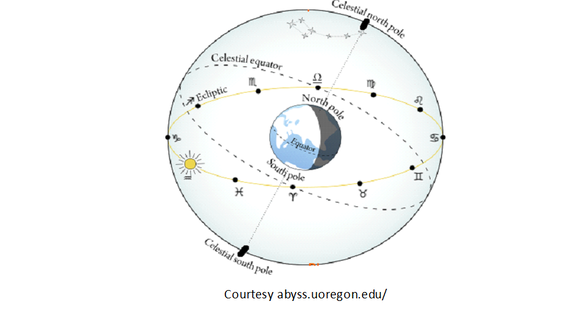 The recent equinox marks the point where the path round the ecliptic crosses the celestial equator. This is when the Sun is overhead at the equator and it continues to travel further north until the summer solstice when it is overhead at the Tropic of Cancer. We see from the diagram that the ecliptic is north of the celestial equator during this period of time. For us in the northern hemisphere we see the stars rotate about the north celestial pole. Don’t worry about some of the additional information on the diagram. The yellow line is the ecliptic and it shows the signs of the zodiac (representing the constellations) and how the Sun appears to pass in front of them as the Earth revolves around the Sun. Remember we are using a model for what we see and this is governed by the movement of the Earth. The Earth spins about its axis from West to East once a day (ie 360 degrees in 24 hours or 15 degrees per hour) and that is why we see the Sun move across the sky daily from East to West. It may not be so obvious that the stars are doing the same thing at night and they move across the sky from East to West at 15 degrees per hour as well. Of course, they also do it during the day, but we cannot see them for the glare of the Sun. The Earth also revolves about the Sun once a year (ie 360 degrees in 365 days or about 1 degree per day or 15 degrees in 15 days) which is why the sky at 10.00pm one day will look like the sky at 9.00pm 15 days later. If you wait till 10.00pm again the celestial sphere has moved on by 15 degrees or 1 hour and all the stars have moved that amount further west. Observing Okay, it is time to look at the stars. The following charts represent the night sky at 10.00pm BST on the 8th of April and at 9.00pm BST on the 23rd April. To use the chart, face south at the appropriate time with the bottom of the chart towards the southern horizon and you will see the stars in the chart. From ancient times the stars have been put into groups called constellations with names supposedly indicating what they represent but this is seldom clear. 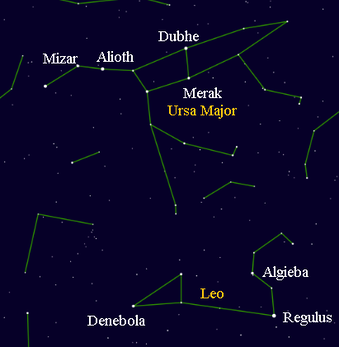 The fact that some stars appear in a group does not indicate that they are close together and their distances can vary by very large amounts. Some groups of stars stand out but may be only part of a constellation and such groupings are called ‘asterisms’. So facing south and going up from the horizon you will see the constellation Leo- The Lion. Fortunately it does look like a crouching lion facing towards the right with the brightest star Regulus (the 15th brightest seen from the northern hemisphere) being its front paw and the curve of stars above that representing its head and mane. This latter grouping of stars is an example of an asterism called ‘the Sickle’, looking like a backwards question mark with Regulus being the dot at the bottom. Now raise your eyes upward to your zenith (the point directly above where you are standing) and you will see what must be the best known asterism in the night sky- The Plough. It contains seven stars and the chart shows three of them named. The Plough is part of the constellation – Ursa Major- The Great Bear, but it takes a lot of imagination to see a bear and that region is mostly referred to as The Plough. In North America it is called the Big Dipper and perhaps here in the UK a better name in modern times would be ‘The Pan’. We said in the introduction that the stars rotate about the celestial North Pole and stars close to there never set but are visible all year round when the skies are dark. Stars like this are said to be circumpolar and Ursa Major is a circumpolar constellation. But note The Plough’s orientation carefully because as it continues on its circular journey it will appear upside down in six months’ time. The constellations are used as signposts in the sky and enable us to engage in a fun activity called ‘star hopping’. Now let’s look at the second chart. 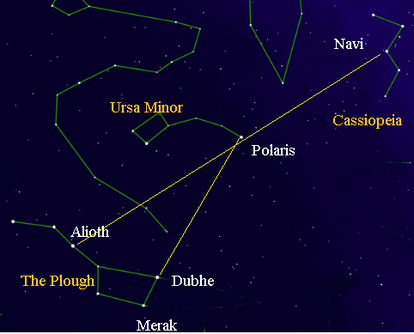 The two stars in the Plough, Merak and Dubhe, are called the pointers and a line from Merak to Dubhe continued onwards leads to Polaris- the Pole Star. The distance is about x5 the distance between Merak and Dubhe. Polaris is very close to the celestial north pole and easily found because although not very bright it is the only star visible in that area. Polaris is in the constellation- Ursa Minor- The Little Bear. Now consider a line from the star Alioth in the Plough, through Polaris and continued onwards for about the same distance again until you see a bright star. It will be the central star of a W formation, an asterism in the constellation Cassiopeia- Queen Cassiopeia in Greek mythology. Most people see the W shape and call it Cassiopeia. The bright star was never given a name in Western or Middle Eastern culture so is referred to as gamma (g) Cas. The convention is to name stars using the letters of the Greek alphabet and an abbreviated form of the constellation. Generally this is done in the order of brightness of the star but it is not a hard and fast rule.However this star has been given the name Navi, allegedly by the American astronaut Virgil (Gus) Ivan Grissom as an anagram of his middle name because it was used for navigation in the early space missions. A fitting tribute to someone who made the ultimate sacrifice for space exploration. The constellation Cassiopeia is also circumpolar and because it is directly opposite the Plough across the North Celestial Pole the two will have exchanged positions in six months so we will see Cassiopeia much better in November. Just imagine the two of them at the ends of a long pole rotating about the North Pole.
Something to look out for There will be a close approach of a five day old Moon and Mars on Saturday 17th April. They will be separated by about 4 degrees initially but will come within a quarter of a degree of each other at their closest. The pair will be visible after 8.30pm as dusk fades above your western horizon. At the end of the month we welcome back Venus to the evening sky and though it is still close to the Sun it will be visible for a short time after sunset above the western horizon. It will have a close approach with Mercury on Sunday the 25th April but you will have to let the dusk sky fade before they become visible. Clear skies. Fortunately we have had the benefit of a few clear skies and so have had a chance to see a bit more of the winter sky. Mars continues to provide good viewing even though it is waning in magnitude and it was good to see its close lunar approach in the middle of the month. On the 28th February the Moon was close to Regulus in the constellation Leo- The Lion, but if you watched Ben Sutlieff’s excellent talk on ‘imaging exoplanets’ and his use of a coronagraph you will understand something similar was needed to block out the light from the full Moon. I settled for observing with one eye and using my thumb at arms length to block out the Moon! Observing The chart below represents the south facing night sky at 9.00pm GMT on the 8th March and at 8.00pm GMT on the 23rd March. Remember it is the spring equinox on Saturday 20th March and we move to BST on Sunday 28th March. 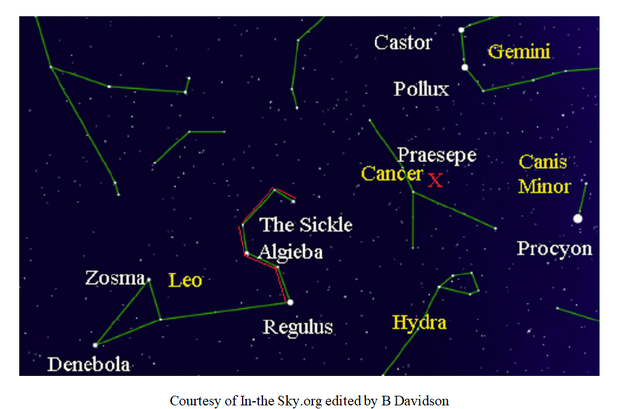 This month we are focussing on just one constellation, Leo- The Lion. The chart includes the stars Castor and Pollux in Gemini and the star Procyon in Canis Minor just to give us our bearings. The chart also includes the faint stars in the constellation Cancer- The Crab and part of the constellation Hydra- The Water Snake but we discussed those last month and they are difficult to see.
Having located the two main stars in Gemini and the star Procyon you need to turn towards the south-east and you will have no trouble in picking out Leo. I think it deserves its name because I can imagine the outline of a lion in a crouching position.The main star is Regulus, the 15th brightest star in the northern hemisphere at magnitude 1.4. Above Regulus is the asterism- The Sickle, which I have outlined in red. The other three stars in Leo which I have named are perhaps not well known but Denebola, Algieba and Zosma have magnitudes of 2.1, 2.2 and 2.6 respectively which explains why Leo stands out so well. Leo is towards the east just now so you will be able to enjoy observing it as it travels westwards over the coming months. Let’s hope we have plenty of clear skies. Something to look out for I mentioned Mars in the introduction and am returning to it again because at the beginning of March it passes close to the Pleiades open cluster and on the 3rd/4th March passes within 2.5 degrees of same. Not as eyecatching as Venus when it did something similar last Spring but well worth observing never-the-less. Throuhout the month it travels eastwards through the constellation Taurus, passing north of the red giant star Aldebaran about the middle of the month.We had difficulty tracking its retrograde motion last Autumn because there were no bright stars nearby but this time you can track its movement relative to Aldebaran.It also has a close approach to a six day old Moon on the 19th March so you will see Mars, the Moon and Aldebaran all together. Last month I mentioned the open cluster, Praesepe, (marked on the chart with a red cross and also known as ‘the Beehive’) as a difficult target for observation and perhaps with better conditions it will be possible in March. Finally with the Spring Equinox on the 20th March we’ll have another chance to to fix directions because on that date the Sun rises due East and sets due West. There is a housing estate being built close to where I live and I’m hoping I don’t have the roof of a house blocking out my horizon to the West! Good luck with your observing! Cloud cover continues to make observing a bit of a challenge but we have had the odd clear sky recently and what a delight it was to see Orion as beautiful as ever. Observing The chart below represents the south facing night sky at 10.00pm on the 8th February and at 9.00pm on the 23rd February. Again Orion and the Winter Triangle (formed by Betelgeuse, Sirius and Procyon) provide all the navigational help required. Last month we were spoilt with all the wonderful bright stars on display but this month you will need to find a dark sky location to observe some dimmer objects. Perhaps you need to have your lockdown exercise walk in the evening to a suitable site free from light pollution. Of course the bright stars are still there but we will be concentrating more on the region to the east of them. 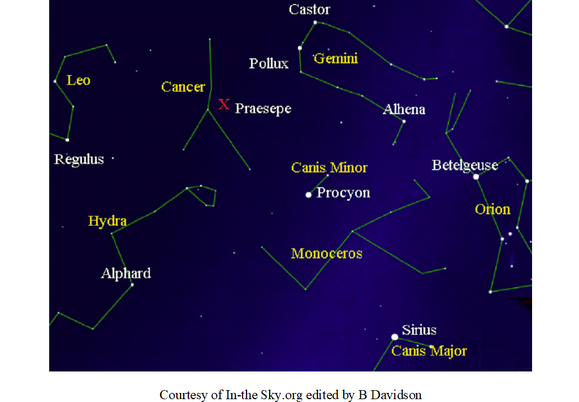 To the north-east of Orion it is easy to pick out the bright stars Castor and Pollux in the constellation Gemini- The Twins, but there is more to the constellation than just those two stars. The bodies of the twins are represented by two lines of faintish stars ending with their feet in the Milky Way. These stars are typically of magnitude 3 to 4 and may be a bit of a challenge depending on light conditions but there is a magnitude 1.9 star, Alhena, representing the feet of Pollux and you should be able to pick it out on a line from Betelgeuse to Pollux.
Now to three new constellations:- Monoceros- The Unicorn, Cancer- The Crab and Hydra- The Water Snake. The bad news is that they lack an abundance of bright stars. However it is easy to know where to look for Monoceros because it is in the middle of the Winter Triangle, bathed in the brightness of the Milky Way. Its brightest star is barely magnitude 4 so to the unaided eye this constellation doesn’t provide very much so we will move on. The constellation of Cancer is one of the zodiacal constellations so needs a mention. It is the faintest of them and is fairly easy to find lying between Gemini and Leo and forming a triangle with the stars Pollux and Procyon. It doesn’t have a particularly distinct pattern but it does have an open cluster, Praesepe, (marked on the chart with a red cross and also known as ‘the Beehive’) which contains about fifty young stars and covers an area the equivalent of three full moons and being in a dark area away from the Milky Way it provides a hazy glow to the unaided eye in good conditions. You will need a pair of binoculars to resolve the individual stars. Finally, Hydra- The Water Snake is the longest of the constellations and stretches about one quarter of the way around the sky with its head in the northern hemisphere and its tail in the southern hemisphere. It is difficult to trace out the chain of relatively faint stars but the six stars forming its head are more conspicuous. The brightest star, Alphard, representing the heart of the snake, is of magnitude 2 and lies alone in a blank region of the sky so is easier to spot on a line from Betelgeuse to just below Procyon and extended about the same distance again. Let’s hope for some really clear skies so that some of these dimmer objects stand out. Something to look out for There is a New Moon on the 11th February so an opportunity for dark skies in the middle of the month. You may also care to look out for the waxing crescent Moon on the following days to the WSW just after sunset. Mars is now in Aries and has a close approach with the Moon on the 19th February. The pair will be visible from 6.00pm onwards above your southern horizon with the Moon passing 3.5 degrees (7 Moon diameters) to the south of Mars after 10.00pm. before sinking towards the horizon and setting after midnight. Of course throughout the month you can continue to enjoy Orion, The Winter Hexagon and the Winter Triangle. In my November 2020 Blog we considered colliding galaxies; we saw that the number density of stars in the Galaxy was so small (just one star per 2.63 cubic parsecs) that collisions between stars are very rare events. Let’s look at a much smaller volume of space - the solar system. Here, number densities are much higher – there are eight major planets, thousands of asteroids and an unknown number of comets. Collisions are much more frequent, although less frequent now than in earlier epochs. Anyone who’s observed the Moon through binoculars or a telescope knows that the Moon’s surface has many craters. Craters are the result of impacts between massive bodies in evolving planetary systems. This is believed to be a fundamental process in planetary formation. The Barringer crater in Arizona (Figure 1) is the most perfectly preserved impact structure on Earth. The reasons this crater is so perfectly preserved include the very dry Arizona climate and the fact that the impact event happened very recently in astronomical terms – about 50,000 years ago. The crater is approximately 1.2km wide and 170m deep and was formed by the impact of a nickel-iron meteorite just 50m in diameter. 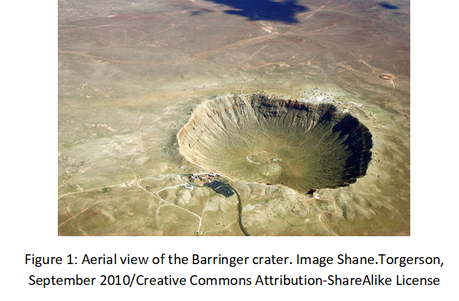 How could such a small object create a hole so much larger? The answer lies in the enormous kinetic energy of the impact. Kinetic energy scales linearly with mass and exponentially (specifically a square law) with velocity: 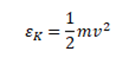 Typically, an impacting asteroid will have a velocity between 15 -30 km per second. The kinetic energy of the Barringer impact is estimated to have caused a blast equivalent to the detonation of a 10-12 megaton bomb. The main cause of damage after impact would have been due to the atmospheric shock wave. Two km from the impact site, the shock wave would have arrived approximately 6 seconds after impact. The peak overpressure would have been around 95.1 psi (normal air pressure is 14.7 psi). The maximum wind velocity would have been an astonishing 1360 mph (approximately Mach 1.8) and the sound Intensity 117 dB (i.e. threshold of pain). That’s quite a score sheet. But, as Table 1 shows, the Barringer event was actually a relatively small event in solar system terms. 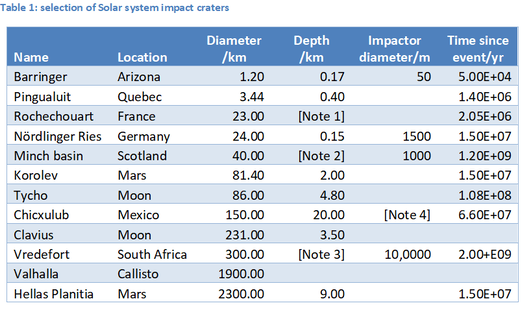
Simple and complex impact structures The Barringer crater is an example of a simple impact crater, having a bowl shape with a covering of shattered rock and mineral fragments. On Earth, simple craters are generally less than 4 km in diameter (Ball, Kelley and Peiser, 2007). Larger impactors produce complex impact craters. Large-diameter craters develop not only a central peak, but often one or more peak rings (French, B 1998) and also concentric ring structures. Many examples of this are seen on the Moon, such as the crater Tycho (Figure 2 and Figure 3) 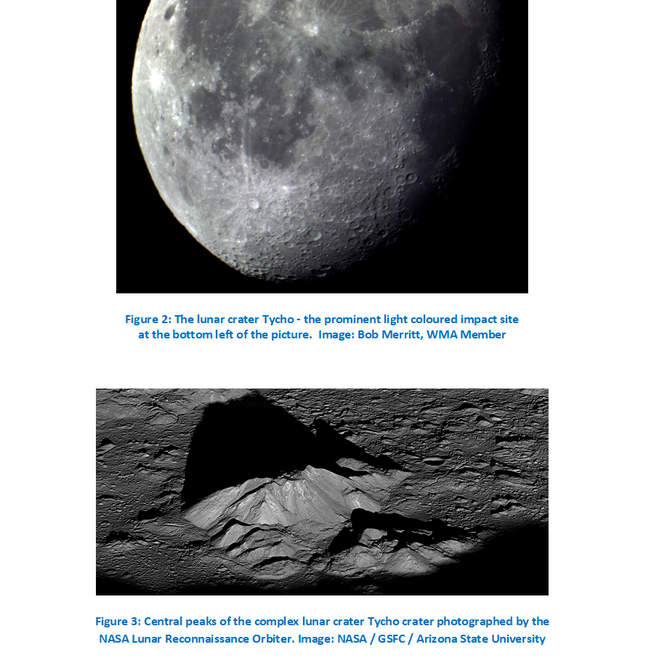 Why are impact craters circular? One might conclude that if the impactor arrived exactly at 90° to the impact site, the crater would be circular. Otherwise it might be more oblate in shape. In fact, nearly all impact craters we observe are more or less circular, as shown by the examples in Figure 4 and Figure 5 below. 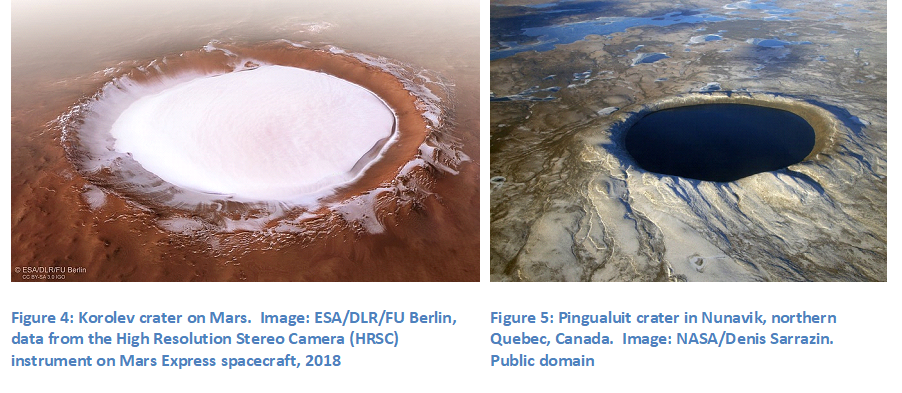 The basic mechanism of impact crater formation is an explosion rather than a ‘skid mark’. Earthquake or volcanic events can be quite geographically widespread, and particularly in the case of volcanic activity, take place over relatively long timescales. Impact events are concentrated at a single point on a planetary surface. The release of enormous amounts of kinetic energy takes place in the case of a small crater in a fraction of a second; and even in the case of a larger impactor in just a few minutes over tens or hundreds of kilometres (French, B 1998). Counting impact craters On planetary surfaces, the more craters there are, the older the terrain is believed to be. This is the case of the heavily crated regions of Mercury (Figure 6). However, there are other considerations as well. On Mars, the surface has experienced erosion as well as burial of craters (Figure 7). a surface covered with many small craters on Mars is often one that is more resistant to erosion, and not necessarily older. 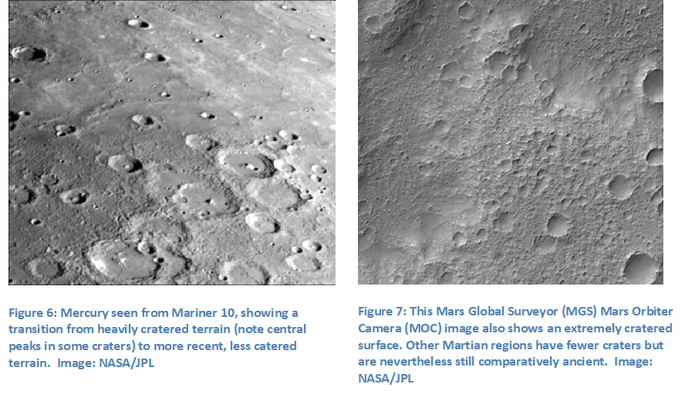 Observation of impacts There have been quite a few impacts observed on Earth and elsewhere in the Solar system. A small meteorite impacted Mars’ surface sometime between September 2016 and February 2019 – the uncertainty being because the MRO can’t be everywhere at once. The impactor is estimated to have been about 1.5m in diameter and the resulting crater to be 15 to 16 meters in diameter (Figure 8). 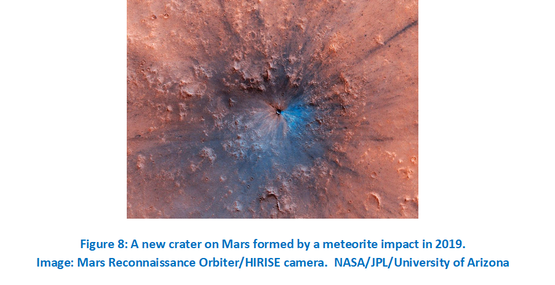 Comet Shoemaker–Levy 9 was a comet that broke apart into 21 main fragments in July 1992 and collided with Jupiter in July 1994. This was the first time a cometary impact with a Solar system planet had been observed. As Jupiter is a gas giant, no crater was formed as such. However, the vast impact scars caused by the explosive entry of the comet were very evident (Figure 9). 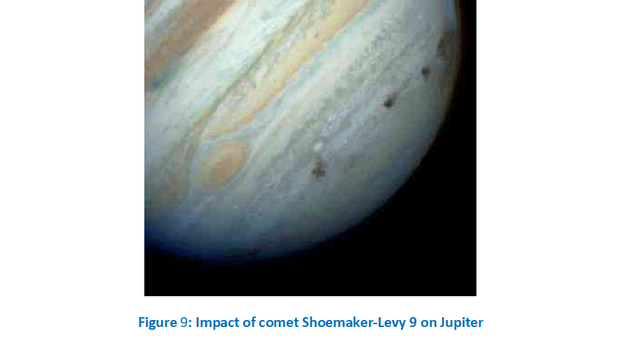 The Chelyabinsk meteor was a small asteroid about 17 meters in diameter that struck Earth's atmosphere at an estimated 18km/second over the city of Chelyabinsk, Russia, on Feb. 15, 2013. The incident was captured on dashcam footage and the luminosity of the object was comparable to the solar luminosity. The atmospheric pressure shock wave caused major damage over a very wide area and over 1200 people were injured.
The largest meteorite fall recorded (NB ‘recorded’, not ‘happened’) in the UK occurred in the Leicestershire village of Barwell on the evening of Christmas Eve 1965. Several villagers did what any English person would do: they reported the matter to the Police, who duly took several fragments into custody. Subsequently, many fragments were found around the local area; the largest weighed over 7.7 kg so it was very lucky nobody was hurt. Among those to visit Barwell not long after the event was Patrick Moore (then, plain Mr. Moore, later Sir Patrick). He found a fragment of the meteorite and offered it to the local museum. He later said, “They told me ‘we have plenty of it so you can keep it for display as long as you make sure it comes to us in your will’”. There is a wonderful story about a Barwell resident whose car was damaged in the incident and he tried to claim off his insurance. His insurers helpfully told him it was an Act of God and therefore they were not liable to pay for the damage. So, he went along to the local church and said since it was an Act of God maybe they could pay, but they didn’t do so. References Katz, B (2019). An Ancient Asteroid Crater May Be Hiding Off Scotland’s Coast https://www.smithsonianmag.com/smart-news/ancient-asteroid-crater-may-be-hiding-scotlands-coast-180972393/ Accessed January 6th 2021. Matson, J (2010). Meteorite That Fell in 1969 Still Revealing Secrets of the Early Solar System. https://www.scientificamerican.com/article/murchison-meteorite/ Accessed January 6th 2021. Earth Impact Database (EID) Ball, A; Kelley, S; Peiser, B (2007). Near-Earth objects and the impact hazard. ISBN 978 0 7492 1887 4 French B. M. (1998) Traces of Catastrophe: A Handbook of Shock-Metamorphic Effects in Terrestrial Meteorite Impact Structures. LPI Contribution No. 954, Lunar and Planetary Institute, Houston. 120 pp. Hirata, N; Ohtsuki, K Keiji; Suetsugu, R (2020). A Huge ring-like structure on the surface of Jupiter’s moon Ganymede may have been caused by a violent impact https://www.kobe-u.ac.jp/research_at_kobe_en/NEWS/news/2020_08_05_01.html Accessed January 6th 2021. For me personally the ‘great conjunction’ of Jupiter and Saturn in December was a big disappointment because whenever I tried to make an observation the cloud to the SW horizon thwarted me. I hope some of you had better luck. However 2020 wasn’t all bad from an astronomical point of view as witnessed by the reminiscing at our online Christmas party of what had been observed throughout the year so let’s look forward to what this year will bring. Observing We had a broad look at the sky last month so we will focus in more detail on the winter sky facing south this month.The chart below represents the south facing night sky at 10.00pm on the 8th January and at 9.00pm on the 23rd January. No need for navigational help this month because Orion is so obvious but facing south and looking up you will find the bright star Capella just short of your zenith. 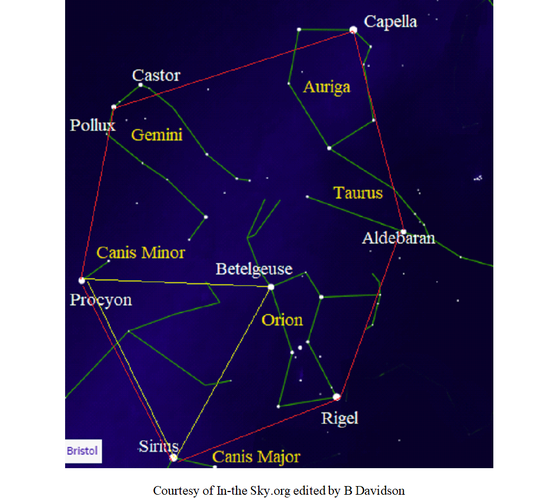 With clear skies we are in for a treat because we have seven of the twelve brightest stars visible from the northern hemisphere. You will be familiar with the chart above but I’ll fill in some details for completeness sake. We have already come across four of the constellations- Orion- The Hunter, Taurus- The Bull, Auriga- The Charioteer and Gemini- The Twins. The two new constellations are Canis Major- The Great Dog and Canis Minor- The Little Dog. In mythology they are the dogs of the hunter Orion but from an observational point of view these constellations are small with little to offer apart from their main stars, Sirius (alpha Canis Major, the brightest star visible from the northern hemisphere) and Procyon (alpha Canis Minor, the 6th brightest star). Incidentally they are two of our Sun’s closest neighbours, Sirius being 8.6 light years distant and Procyon 11.4 light years. These two stars along with Betelgeuse in Orion form an asterism known as the Winter Triangle depicted in yellow in the diagram.
But Betelgeuse is roughly in the middle of another asterism- the Winter Hexagon comprising the stars Sirius, Rigel, Aldebaran, Capella, Pollux and Procyon and depicted by the red outline in the diagram. It is obvious with the unaided eye that these stars are different and within that grouping, including Betelgeuse, you will find a yellow giant (binary twin), a red supergiant, a blue supergiant, a red giant, a yellow star and two stars which are part of a binary system with a white dwarf (not visible to the unaided eye). And allowing for variability they all have a magnitude of about 1 or brighter.If that doesn’t make you reflect on what you are looking at in the winter night sky I don’t know what will. Now that we are in lockdown again if you are not sure which star fits into which category why not do a little research to fill in your time of an evening! You may be thinking I’ve said nothing about Castor, the second bright star in Gemini, because it’s not as bright as the others but in fact it is an amazing star in its own right.To the unaided eye, the star Castor appears as a bright pinpoint of light but it’s actually three pairs of binary stars – six stars in all – in a complex dance about a common centre of mass. Even a fairly small telescope will show Castor as two stars and perhaps a glimpse of a much fainter star nearby, also part of the Castor system. Each of these three stars is also double but they cannot be resolved in a telescope and have to be inferred from spectroscopic data. Something to look out for Although the ‘great conjunction’ is now in the past, Jupiter and Saturn continue to be of interest as they have a close approach with the planet Mercury between the 9th and 14th of January, visible above the south-west horizon from around 4.30pm as darkness falls, and you need to be quick as they are visible for only a short time. On the final day they are joined by a crescent Moon. We will be saying ‘Goodbye’ to Saturn and Jupiter as they are lost to view behind the Sun but Mercury continues to its greatest elongation and highest altitude above the horizon on the 27th January. Let’s hope for some clear skies to show off the winter night sky to its best. We have been struggling a bit recently with observations but the close approach of the Moon and Mars produced the goods on the 25th November. It was good to see. Let’s hope ‘the great conjunction’ lives up to expectations but more on that later. Observing December is the last month in the year and the winter solstice takes place on the 21st so I thought it was time to take a look at the bigger picture rather than focussing on the detail and where better to start than the winter night sky.The charts below represent the whole night sky at 10.00pm on the 8th December and at 9.00pm on the 23rd December. The first chart is the night sky facing north. 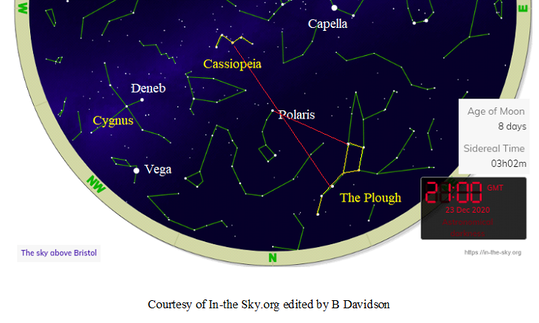 Most people believe that it is a good idea that we all know some basic first aid. How to deal with cuts, bruises, stings and nose bleeds. More serious problems can be left to the professionals. By the same token I think everyone should know something about observing the night sky and I’ve come up with my list of five objects in the winter night sky which I think everyone should recognise. (Yes, I did have a job limiting it to five!). Obviously this is my personal list and some of you may come up with your own different selection. These are the things which I think you should be pointing out to your children and grandchildren on a crisp clear winter’s evening. It might just get them hooked on astronomy.
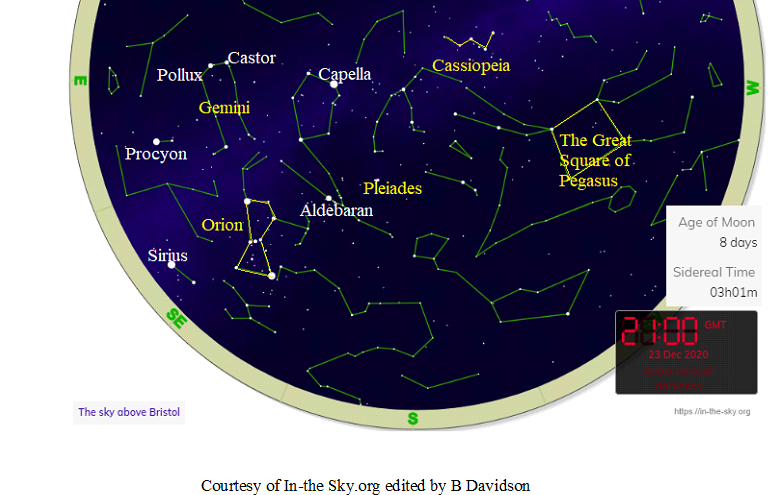 This second chart is the night sky facing south. 3. Orion As I said last month, Orion has everything and I would defy anyone not to have it on their list of things to see in the winter’s evening sky. It is a brilliant object in the sky and attracts everyone’s attention. Its bright stars and distinctive belt are likely to produce questions so you might want to be able to name Betelgeuse and Rigel if asked. Like The Plough, Orion also leads you on to other objects like my next choice. 4. The Pleiades ( or Seven Sisters) The Pleiades doesn’t form a large object in the sky but it does catch the eye when looking at the sky hence on the list. Found by extending a line from Orion’s belt through the red star Aldebaran. Use a pair of binoculars to enhance the view. 5. Sirius Simply a star but it does happen to be the brightest star in the night sky when it is present so it should be up there with the tallest mountain and longest river as an item of general knowledge. It is also of historical interest because its appearance was used by the early Egyptians to tell that the river Nile was about to flood. Again easily located to the bottom left hand side of Orion. I’m sure many of you will have your own favourites and might be wondering why I have not included them but I wanted to restrict the list to five. Remember this is just a starting point. Something to look out for Mars continues to be easily observed during the evening but this month it will have to take second place to ‘the great conjunction’. First though, there is a close approach of a three day old Moon with Jupiter and Saturn on the 17th December. Visible above the south-west horizon from around 4.30pm as darkness falls, this will provide an opportunity to get your bearings right for the ‘great conjunction’ four days later. On the evening of the winter solstice, 21st December, the planets Jupiter and Saturn will be within about a tenth of a degree of each other. Remember that the Moon has an angular width of about half a degree so these two planets will be separated by about one fifth of the Moon’s diameter. Jupiter is much brighter than Saturn so they might be difficult to resolve. Of course these planets are widely separated in space and this optical effect comes about because Jupiter revolves around the Sun in just under 12 years whereas the orbital period of Saturn is over 29 years and so Jupiter laps Saturn every twenty years. This is the closest they have appeared since 1623 and won’t appear as close again until 2083 so definitely a once in a lifetime event. 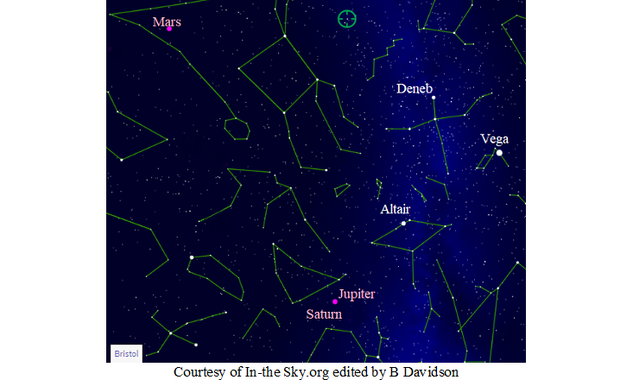 I’ve included the chart just to show that Jupiter and Saturn will be close to the horizon and will set at 6.30pm. The Sun will set at 4.03pm so you will need to be outside during twilight to be ready to observe either side of 5.30pm. and you will need an unobstructed view to the south-west/west horizon. Let’s hope the skies are clear. The planets will still be within a degree of each other the weeks either side of the winter solstice so try to catch them whenever you can. The diagram below shows their separation over a two week period. 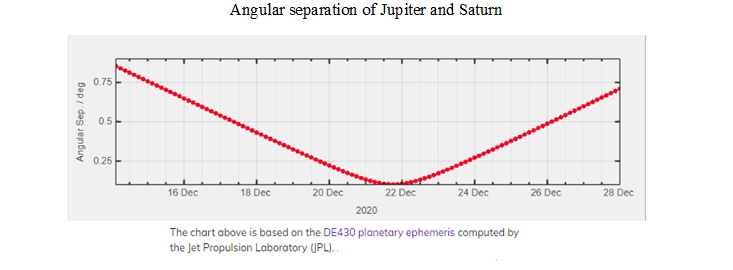 As 2020 draws to a close we can look forward to a once in 20 year astronomical event, the conjunction of Jupiter and Saturn, on the 21st of December. What is a Conjunction? Occasionally two or more objects meet up with each other in our sky. Astronomers use the word conjunction to describe these meetings. Technically speaking, objects are said to be in conjunction in that instant when they have the same right ascension on our sky’s dome. Practically speaking, objects in conjunction will likely be visible near each other for some days. The word conjunction comes from Latin, meaning to join together. In language, conjunctions relate to clauses brought together in sentences with words like and. In astronomy, conjunctions relate to two or more objects brought together in the sky as we see them. An inferior conjunction is when an object passes between us and the sun. Any object in space that orbits the sun closer than Earth’s orbit might pass through inferior conjunction from time to time, assuming its orbit lies more or less close to the ecliptic. Usually, though, when you hear the words inferior conjunction, astronomers are speaking of the planets Venus and Mercury, which orbit the sun inside Earth’s orbit. Astronomers sometimes refer to Venus and Mercury as inferior planets. When they’re at or near inferior conjunction, we can’t see them. They’re hidden in the sun’s glare. Occasionally, though, Venus or Mercury can be seen to transit across the sun’s disk at inferior conjunction. Consider also the moon. It passes between the Earth and sun at new moon once each month. Therefore you could say that the Moon is at inferior conjunction when it’s a New Moon. A superior conjunction is when an object passes behind the sun from our point of view. Think of Venus or Mercury again. Half of their conjunctions with the sun – when they are brought together with the sun on our sky’s dome – are inferior conjunctions, and half are superior conjunctions. It’s kind of fun to imagine them on an endless cycle of passing in front of the sun, as seen from Earth, then behind it, and back again, like watching squirrels running around a tree. Meanwhile, the superior planets – or planets farther from the sun than Earth such as Mars, Jupiter, Saturn, Uranus and Neptune – can never be at inferior conjunction. 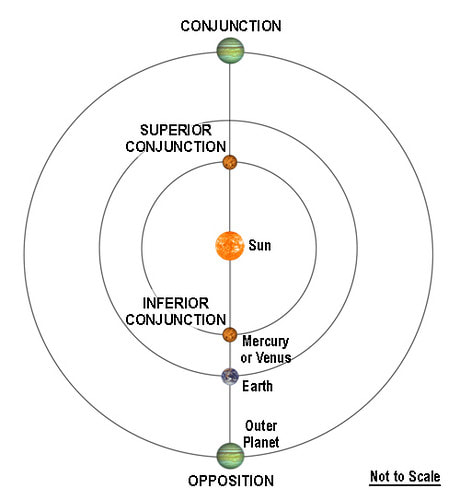 Diagram showing the poistion of planets relative to each other during an inferior conjunction, superior conjunction and at opposition. However there are many more conjunctions that occur which fall into neither of these categories. They occur when planets, or a planet and the moon, appear close together in the sky. The conjunction between Jupiter and Saturn is one of these and is often called a Great Conjunction. How often do they happen? As a result of their long orbits, Jupiter and Saturn meet in the sky only once every 20 years. In this period of time, Saturn completes two-thirds of its 30-year orbit (since 20 is two-thirds of 30). In the same period, Jupiter completes one 12-year orbit, plus, in the remaining 8 years, two-thirds of its next orbit (since 8 is two-thirds of 12). In other words, 20 years is the time it takes Jupiter to catch up and pass Saturn again as they circle the Sun. The last conjunction of Jupiter and Saturn occurred on 28 May 2000, but was almost impossible to view because it occurred while the two planets were just 14.9° west of the Sun from our point of view. So the spectacle was largely lost in the Sun’s glare. After 2020, the next great conjunctions will occur on November 2, 2040 and April 7, 2060. On both these occasions, the minimum separation of Jupiter and Saturn will be 1.1 degrees—which means they will appear 11 times further apart from each other than on December 21, 2020. In fact, the 2020 great conjunction of Jupiter and Saturn is exceptionally close. Over a period of one thousand years, from 1600 to 2599, there are only six great conjunctions where the minimum separation between Jupiter and Saturn is less than 0.2 degrees: 1623, 1683, 2020, 2080, 2417, and 2477. Though each successive ‘great conjunction’ takes place around 117º apart in the sky, the planets’ orbital resonance is such that each conjunction returns to the same part of the sky roughly every 800 years. How and when to see it The conjunction actually occurs at 13:30 GMT – that’s when the right ascension of the two planets will be the same, but the Sun will still be high in the sky at that point. When the Sun sets at 16:05 (according to Heavens Above website) the two planets will only be 14 degrees above the south-western horizon and set less than 2hrs 30mins later. 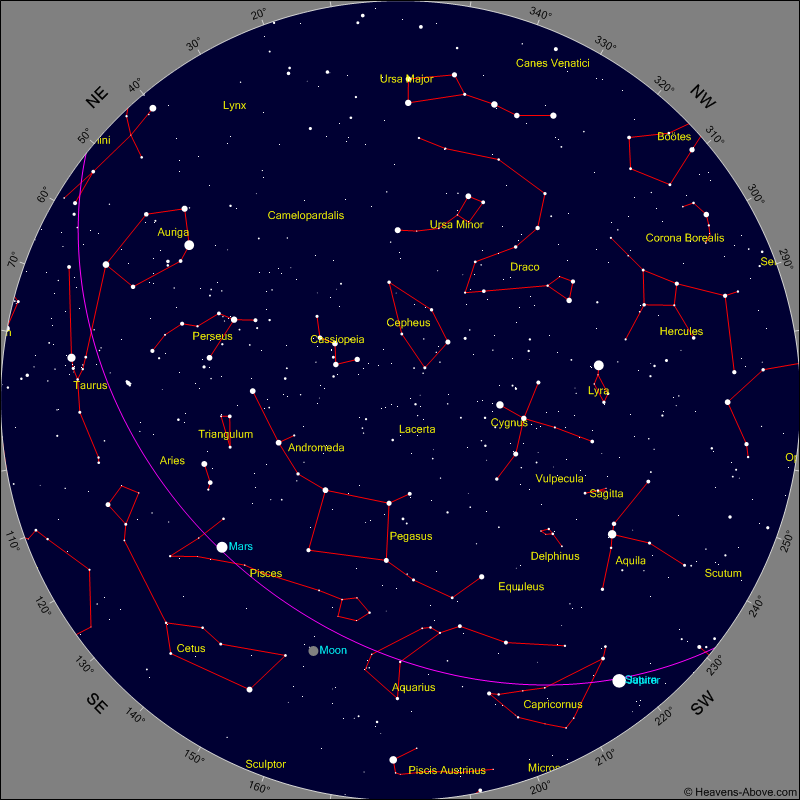 Sky chart from Heavens Above for 17:00GMT on December 21st. Location set to Wells. But don’t just rely on clear skies on the night. The two planets are already nice and close together as we look at them so just in case the great British weather lets us down on the 21st make sure you take a look in the evenings leading up to the big night. 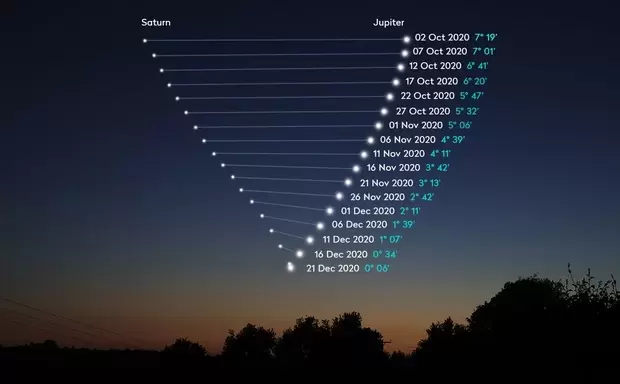 Image from Sky at Night magazine. Saturn and Jupiter appear to close in on each other as the Great Conjunction 2020 approaches on 21 December (apparent distance given in degrees and arcminutes). Credit: Pete Lawrence. Regular readers of my Blog will know that I come more from the data analysis side of astronomy than the pretty pictures side. So this month just for a change, we’ll have some wonderful images as well as data. So, let’s start off with … a pretty picture! 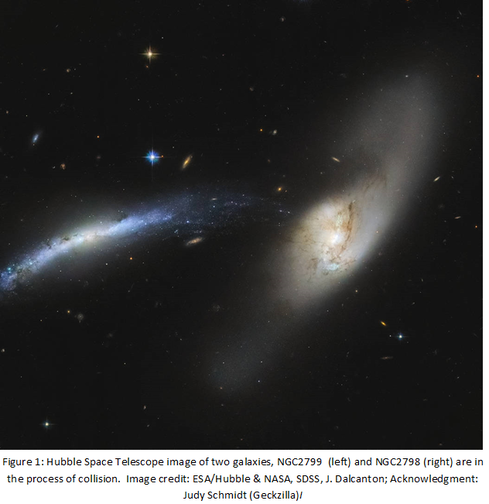 In fact, Figure 1 is far from being ‘just a pretty picture’ – this stunning image shows two galaxies, NGC2788 and NGC2789 which are in collision. How do we know these galaxies are interacting and that what we are seeing is not just a trick of perspective? If we look at the NASA Extragalactic database, we see the data in Table 1: 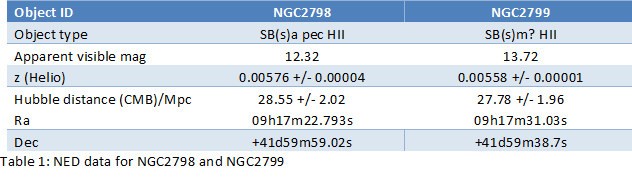 The first thing we can see is that both galaxies should be visible in modest sized amateur telescopes. The two galaxies have similar magnitudes, as shown above, although remember that each order of magnitude decreases brightness by approximately 2.5. The fact that NGC2798 and NGC2799 are close together is revealed by two parameters: their redshifts are similar within two parts in 10,000. And their Hubble distances with respect to the Cosmic Microwave Background (CMB) are approximately only 2.78% different. Will stars collide? The NASA/ESA press release that accompanied this picture states “While one might think the merger of two galaxies would be catastrophic for the stellar systems within, the sheer amount of space between stars means that stellar collisions are unlikely”. How can that be established? As a first approximation, we can model a spiral galaxy such as our Milky Way (MW) as a disk where the radius of the disk, is about 50,000 light-years or 15.33 kpc and the thickness of the disk is about 0.5kpc. The number of stars in the MW is estimated to be N ~ 10¹¹ We are now interested in parameter called the number density of stars - simply, the number of stars divided by the volume of the disk. However, we can’t work out the volume of the disk simply by calculating the volume of an equivalent cylinder. In reality, the disk of a spiral galaxy is not homogenous – it has been known since the’60s that the spiral arms are density waves (Lin & Shu, 1964). Let's assume 70% of stars are in the spiral arms; there are no stars in the voids between the arms; and that the arms make up 50% of disk. These are of course gross assumptions, good only as a first approximation. The results (calculations are available in Excel® if you are interested) are shown in Table 2 below: 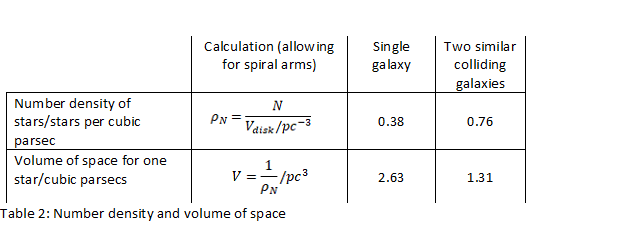 In the ‘Single galaxy’ column the number density of stars is less than one star per cubic parsec; expressed differently: in one cubic parsec of space, there is on average less than one star. In fact, on average we’d need to search 2.63 cubic parsecs of space to find a single star. In the ‘Two similar colliding galaxies’ column, we imagine two spiral galaxies colliding head on. Here, the number density is doubled as the spiral arms collide. Correspondingly, the volume of space on average we expect to encounter a star is still 1.31 one cubic parsecs. Let’s just remind ourselves how large a volume of space a cubic parsec is. Imagine a cube of space one parsec on each side. That’s 3.26 light-years on each side or, if you prefer, 3.1*1013 km on each side. 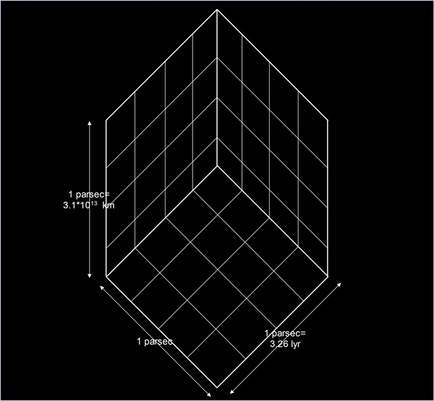 Even a very large star such as the red supergiant Betelgeuse is a very small object in all that space, so even in a galactic collision, as the NASA press release says, the chances of two stars colliding is very small. How common are galaxy collisions? The answer is – not uncommon. The next two images show some well-known examples. 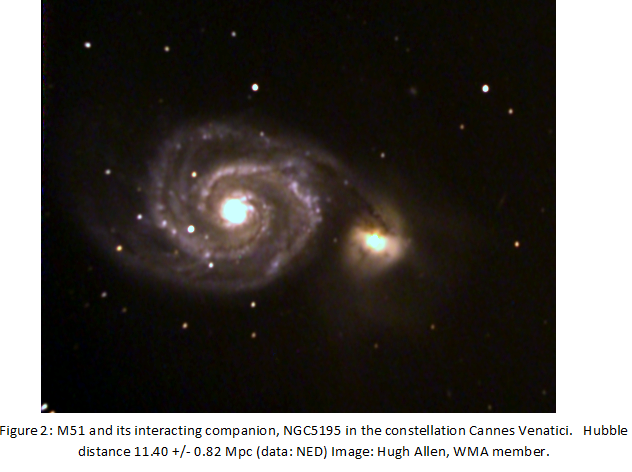 The image in Figure 3 shows the distorted disk of NGC4631. This is caused by NGC4631’s interaction with two much smaller galaxies, NGC 4627 and NGC 4656. 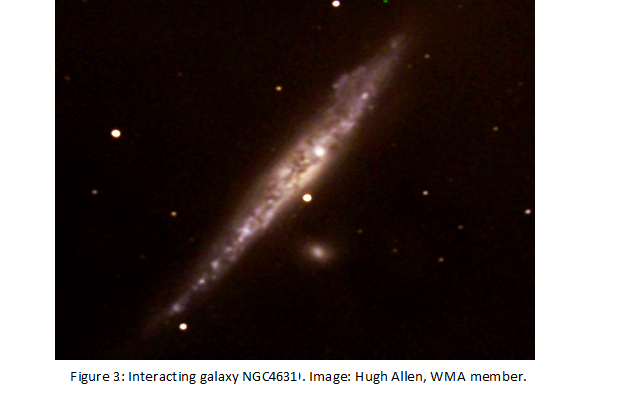 The plot in Figure 4 shows the results of radio emissions of NGC4361 reported in Neininger & Dumke (1999). The small dark object above the disk of NGC4631 is the dwarf elliptical galaxy NGC 4627 with which NGC4631 is interacting. 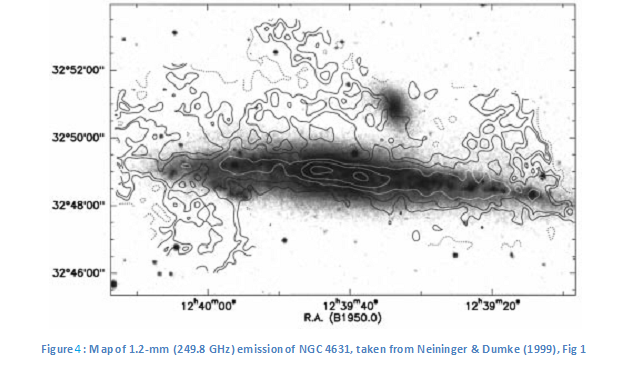 Another source of data about colliding galaxies is Galaxy Zoo, a project that enables citizen scientists to categorise and analyse images of galaxies taken by professional observatories. One of Galaxy Zoo’s initiatives is the Galaxy Merger project (Holinchech 2016). The data collection phase is now complete and comprises 62 colliding galaxy pairs (I have this data as an Excel table for anyone interested). A good example from the Galaxy Zoo merger table Is ARP148 in Ursa Major (Galaxy Zoo mergers table ID49). This is also called Mayall’s Object, named after American astronomer Nicholas U. Mayall (not John Mayall), who discovered the object in 1940. 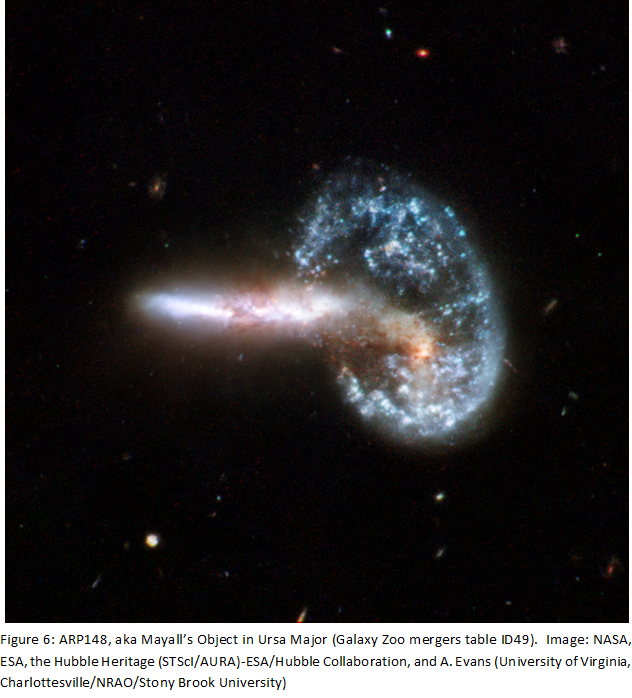 Can it happen here? There is a short answer: ‘Yes’. For example, the Sagittarius Dwarf galaxy has been involved in multiple collisions with our Milky Way galaxy and this is the probable reason for the warped nature of the Milky Way’s disk (Law & Majewski, 2010). A recent determination of the radial velocity of the Andromeda galaxy, M31 with respect to the Milky Way indicates a velocity of −109.3 ± 4.4 kms per second, the negative sign indicating M31 is moving towards the Milky Way. The same research indicates a low transverse velocity of 17 km per second, indicating the probability of a head-on collision between the two galaxies (van der Marel, 2012) 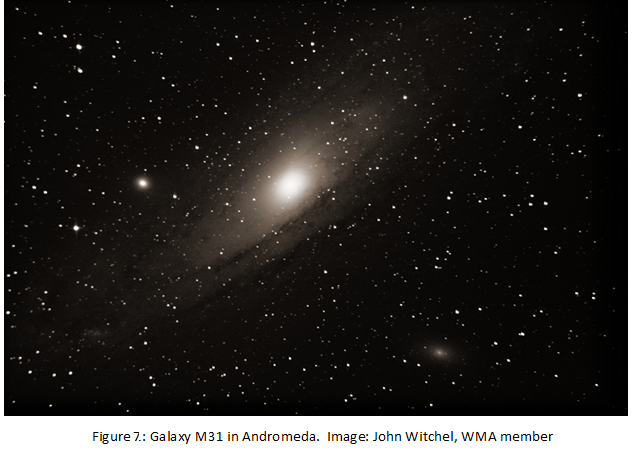 The end result of this collision will be a very massive elliptical galaxy.
Acknowledgements This Blog is not a scientific paper, although it lists various scientific papers as sources in the References section. I am indebted to Hugh Allen for drawing my attention to the paper by Neininger & Dumke (1999). Data used in Table 1 was obtained from the NASA Extragalactic Database. The NASA/IPAC Extragalactic Database (NED) is operated by the Jet Propulsion Laboratory, California Institute of Technology, under contract with the National Aeronautics and Space Administration. References Holincheck et al (2016). Galaxy Zoo: Mergers – Dynamical models of interacting galaxies. MNRAS459,720–745 (2016). doi:10.1093/mnras/stw649 Law, D; Majewski, S (2010). The Sagittarius dwarf galaxy: a model for evolution in a triaxial Milky Way halo. 2010 ApJ 714 1. DOI: 10.1088/0004-637X/714/1/229 Lin, C & Shu, F (1964). On the Spiral Structure of Disk Galaxies. ApJ, vol. 140, p.646 . DOI: 10.1086/147955 Neininger, N; Dumke, M (1999). Intergalactic cold dust in the NGC 4631 group. DOI: 10.1073/pnas.96.10.5360 van der Marel, R et al (2012). The M31 Velocity Vector.II. Radial Orbit Towards the Milky Way and Implied Local Group Mass. ApJ, 753:8 (14pp), 2012 July 1. DOI: 10.1088/0004-637X/753/1/8 https://iopscience.iop.org/article/10.1088/0004-637X/753/1/8/pdf |
AuthorWMA members Archives
March 2024
Categories |
 RSS Feed
Proudly powered by Weebly